Post #51: Adapting the industrial reactor for research – V (Bifurcation of IV into cdb and tdb: the major triumph of thermostoichiometry)
∆H and ‘s’ are the twin pillars of thermostoichiometry connecting the theoretical (with molar transformations) and the observed heat release (with mass and observed ∆T). The convention in chemical energetics of treating ∆H of most reactions as constant over moderate ∆T is a relief but must be either reasoned out in our case or the resulting error acknowledged and quantified. We will soon see if we can equate the two ‘heats’ to arrive at ∆H of reactions, deploying basic mathematics and CS, we will then unravel the marvels of thermostoichiometry with real utilities.
Breakdown of IV into tdb and cdb – a triumph of thermostoichiometry
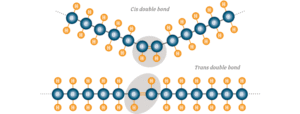 The basic flaw in IV in failing to distinguishing between cdb and tdb has not been acknowledged in mainstream literature, probably as a concession to its simple and practical utility vis-a-vis oils in their natural or even refined forms. In hydrogenated stocks, however, the cdb-tdb bifurcation is crucial in deciding the physical, chemical and physiological properties or utiities. The near-magical possibility of tracking the tdb (not tfa) in the reaction mixture during live hydrogenation, totally externally, at a low cost is definitely a triumph of insightful STEM logic stemming from common sense and practical shopfloor experience.
(Important: The origin of this series of posts is an individual working away at his desktop, retrieving memories of shopfloor experience far away but imagination and basic inlelligence by his side. We will develop below an astonishing equation showing that the ratio of the rate of heat generation in the batch and the rate of saturation of bonds is a constant at the tdb maxima, if the ∆H of the three component reactions is treated as constant. For obvious reasons, this is meant to be either corrected with reasoning or treated as a springboard for further research, not necessarily ruling out improvements.)
The heat balance: Total cumulative exothermic heat Q = n1.∆H1 + n2.∆H2 + n3.∆H3 where Here, n1, n2, n3 are respectively the number of moles of cdb directly hydrogenated to sdb, number of moles of cdb isomerized to tdb and number of moles of tdb hydrogenated to sdb. Applying Hess’s Law of Constant Heat Summation:
Total exotherm for ∆I in a batch = Q = n1(∆H2 + ∆H3) + n2.∆H2 + n3.∆H3 = (n1 + n2)∆H2 + (n1 + n3)∆H3 = (1000x + 10xy + 0.5m1).s.∆Trm + Mre.sre.∆Trm + 0.5Mins.sins.∆Trm.
Visit the previous post for an explanation. The temperature in hydrogenation increases continuously during the rising T stage and, as noted earlier, this author has not reliably learnt to what extent the rate enhancing effect of T is offset by the diminishing ‘concentrations’ and hence the T-∆I pattern is not quantitatively rationalized – a challenging and interesting research thread. But since Q or T can always be plotted against ∆I, we do have impirical data on it.
Logic + molar math = meaningful outcomes : 1. (n1 + n2) is the total cis double bond disappearance determinable thru the relationship: (n1 + n2) = (39.37*x*I0 – moles of residual cis double bonds in the batch determined by of the sample drawn at the end of ∆I i.e. the clear filtrate going to the ‘hard oil’ or hydrogenated stock tank.)
- (n1 + n3) is the total hydrogenation in terms of moles = 500m1.
Note that (n2 – n3) is the difference in the tdb formed and disappeared thru cdb isomerization and tdb hydrogenation. We have already seen how it can go thru a maxima before very gradually decreasing when n3 dominates.
- If ∆H is reasonably constant, the ‘n’ terms become varying coefficients of two ‘constants’ leading to two ‘Q’ values:
(n1 + n2)’∆H2 + (n1 + n3)’∆H3 = Q1
(n1 + n2)’’∆H2 + (n1 + n2)’’∆H2 = Q2
In classical selective hydrogenation of soybean oil from IV 130 to 70, two ‘stocks’ with IV 73 and 67 can yield two values of Q and the ‘n’ numbers as shown above. These two simultaneous equations yield the two ∆H numbers – for the present accepted as ‘reasonanbly constant’. Note the ‘jugadu’ scheme of allowing merging of resultant stocks in the ‘base stock tank’. If ∆H changes (say, decreases) as the cycle progresses, using the ‘terminal’ ∆H values through out will obviously nudge the ‘n’ values nominally upwards for observed actual Q. The extent can be easily verified from the analysis of the hydrogenated product stock.
- The graphical plot of Q vs t/∆I is a potent research avenue.
- Tracking of the all-important tdb:
(n1 + n2)∆H2 + (n1 + n3)∆H3 = Q
→ (n1 + n2)∆H2 = Q – 500m1∆H3
→ (n1 + n2) = [Q – 500m1∆H3]/∆H2
→ 39.37xI0 – (residual cdb) = [Q – 500m1∆H3]/∆H2
→Residual cdb = 39.37xI0 – [Q – 500m1∆H3]/∆H2
→ 39.37xI – residual tdb = 39.37xI0 – [Q – 500m1∆H3]/∆H2
→ Residual tdb = [Q – 500m1∆H3]/∆H2 – 39.37x∆I
Substituting 12.7m1/x for ∆I,
Residual tdb moles = [Q – 500m1∆H3]/∆H2 – 500m1
= Q/∆H2 – 500m1[∆H3/∆H2 + 1]
= Q/∆H2 – 500m1[∆H1/∆H2]
= [Q – 500m1∆H1]/∆H2, and
d(moles of tdb)/dt = (1/∆H2)dQ/dt – 500[ ∆H1/∆H2]dm1/dt
Thus the observed Q (itself increasing in consonance with varying rates of the three reactions) and m1 at any stage determine the residual tdb moles. The initial Q resulting from cdb hydrogenating m1 as well as m1-independent geometrical isomerization dominates the equation to reduce the effect of increasing m1 and tdb moles increase. At a certain m1, it maximizes before beginning to decrease as a result of weakening Q and continuously increasing m1. At tdb maxima, (1/∆H2)(dQ/dt) = 500(∆H3/∆H2 + 1)(dm1/dt) or [dQ/dt]/dm1/dt = 500∆H1.
Note: (i) This math leads to the astonishing realization that the ratio of rates of sensible heat release and chemical hydrogen consumption at the tdb maxima is a constant determined by the heat of hydrogenation of cdb. (ii) The tdb moles can also be plotted against t, T, ∆I, m1 to determine the tdb maxima which has two practical uses: (a) The option of halting hydrogenation at a desired tdb level. (b) Connecting tdb with tfa and cla to locate their maxima; the commercial importance of the latter is obvious in terms of delivering cla as cooking oil at a fraction of the encapsulated or gummified form. (iii) If you look closely, the product of residual tdb and ∆H2 is the difference between the total measured heat release and the heat attributable to bond hydrogenation.
- Commercially available CLA is known to be rich in 9,11 and 10,12 conjugated FA with a trans bond each; if TFA were human they would be allowed a smirk! The argument, of course, is the very small consumption requirement for benefits. It is, therefore, logical to argue that the CLA maxima (before it starts getting saturated to oleic acid isomers) has to be close to the tdb maxima. A sample withdrawal at + and – 2 IV from the located and confirmed tdb maxima, can easily confirm the tdb-CLA relationship.
Stoichiometry vs Thermochemistry in hydrogenation insights
Stoichiometry of any reaction is inviolable and hydrogenation of oils cannot be an exception despite its oft-discussed idiosynchrasies. Robust application obviously demands meticulous hydrogen accounting but beyond that, live reaction tracking in terms of IV – totally externally and cheaply – is entirely feasible. Given the sacrosanct condition-trajectory relationships, this is essentially, reliable tracking of the product quality.
Thermochemistrys is indirect and elaborate with greater possibility of errors but, done meticulously, these slippages can be learnt from, a la ML! The impressive triumph is the possibility of tracking the formidable tdb and the useful CLA. Obviously, tdb is not tfa unless the remainder ufa are MUFA which can be known.
Steps of hydrogenation thermostoichiometry practice
- Determine the specific heat (or heat capacity as an extensive property) of the reaction mixture at about 6 ‘milestone’ temperatures during rising temperature hydrogenation. Typically, they can be 120 (starting T), 130, 140, 150, 160, 170 and 180 deg C – the isothermal stage beginning and end.
- Plot ‘s’ vs t/∆I/m1/T. We already know that these numbers are very closely related in controlled, product driven hydrogenation. Continuousize the points into a curve. This is ‘s’ at any stage.
- Start the reaction. Monitor T, m1 continuously and hence, thru a code, the heat released (Q).
- Process the data to derive dQ/dt and molar transformation as detailed above – the core of hydrogenation thermostoichiometry.
Variation in the component reaction ∆H
Origin of ∆H: The heat of a reaction originates in the difference in the enthalpies of the reactants and products. A reaction leading to more stable products as a whole reduces the enthalpy of products causing ∆H to be negative with heat release – the classical exothermic reaction. In fact, this is a major contributor to the thermodynamic spontaneity of reactions. This difference in enthalpies stems from the difference in the bond enthalpies of reactants and products in reverse, i.e. an exothermic reaction increases the bond enthalpies of more stable products. At a given temperature, therefore, the ∆H of a reaction is its characterizing feature.
Sidelining of variations in ∆H: Interestingly, I do not remember coming across a single academic exercise during my graduation or post graduation with data on ∆H of a reaction at two or more temperatures which could be a limitation of the ‘only essential’ chemical engineering education of a food technologist. Many industrially important reactions are carried out at ‘optimal’ temperatures implying nearly constant temperatures and elimination of the ∆H variations. Most batch reactors are equipped with ‘overages’ of cooling capacity and hence the occasional requirement of carrying out a reaction at a different temperature (and with implied different heat release rate) can’t bother operators much.
In reality, treating ∆H of reactions as constant over moderate temperatures is an accepted practice. In our case, however, we process the ∆H and Q data even during the rising temperature stage and derive potentially commercially useful insights from it. Hence, we must either rationalize (practically) constant ∆H and note the errors introduced by it or create a protocol to track ∆H.
Validating the constant ∆H values in case of hydrogenation
A general condition for ∆H to remain practically constant: ∆H of a reaction in kcals/mole of a product (or reactant) at temperature T1 is difference between the total enthalpies of products and reactants as per reaction stoichiometry. Obvioualy, stoichiometry does not change with the progress of the reaction and hence, definition of ∆H at temperature T2 is the same with molar enthalpies now expressed at temperature T2. In an actual industrial reaction, the actual moles can often be thousands (and not always in stoichiometric proportions) and the actual Q release is the same enthalpy difference at stoichiometry-dictated molar transformations resulting in ∆T determined by instantaneous mass and ‘s’.
Now for ∆H as kcals/mole of a product to remain practically the same at T2, the enthalpy difference has to remain the same – this time at T2. This smoothly leads to the realization that the increase in enthalpies at T2 (from T1) has to be practically the same for reactants and products as a whole. This has conventionally reported as heat capacities of reactants and products remaining practically constant. Given that chemical reactions are just breaking and making of bonds, the reactions in which these changes happen at very few bond sites on large molecules with elaborate remaining bonding remaining unaltered, this possibility can be expected to be operating. In our case, hydrogen – the alien, unavoidable oddity – can queer the pitch for both bond saturations. Two chemically and physically vastly different materials – oils and hydrogen – being chemically merged to create a chemically and physically close material with crucial physical and chemical differentiation! No wonder it requires a catalyst and is still not fully controllable!!
Geometric isomerization: Now, the isomerization equation of n2 moles of cdb has one entity each on the RHS and the LHS of the equation and hence the difference in ∆H at two different temperatures can stem only from the different rates of heat capacity changes for each. The cis and trans configurations are the only difference between the two as reactants with the trans form leading in heat capacity because of the relative rigidity of the shape with the same type of bonds. In case of oleic acid and elaidic acid (trans oleic acid), this is indeed the case and the increases from 120 to 180 deg C also are about the same.
Hydrogenation for both cis and trans forms is essentially an addition reaction having hydrogen on the LHS of the equation. The addition of strong, stable C-H bonds on saturation should arrest heat capacity increase at increasing temperatures. This is indeed the case, between 120 and 180 deg C, it increases by about half the amount as unsaturated cousins. This would obviously, reduce the exothermicity introducing an error.
Hydrogen’s thermodynamic state during expansion in the prv, bubbling in the RM, migration to catalyst sites or eruption into the headspace is a matter of research that I have not been privy to. But with about 7 times the heat capacity of oils, it increases moderately from RT to about 100 deg C and then increases much less. Coupled with the less enthalpy increase in sfa with temperature than tfa and cfa, this should dampen ∆H of bond saturation marginally with rise in temperature.